

M&M Multifamily Report July 2020
High Cost of Homeownership Sustains Rental Demand; Investors Target Locales With Higher Return Thresholds
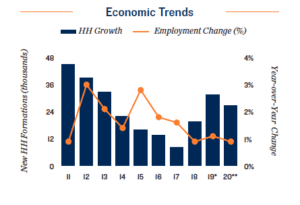
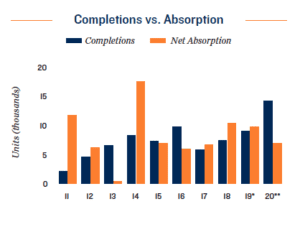
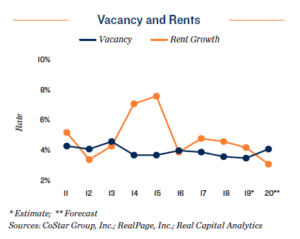
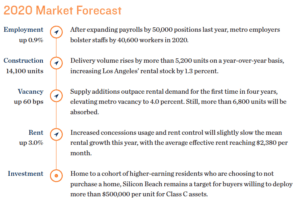
Tight conditions preserved amid wave of supply additions. In each of the previous three years rental demand in Los Angeles outpaced elevated levels of construction activity, compressing vacancy to a cycle-low level entering 2020. Limited unit availability occurs at an opportune time, as the county’s rental inventory will swell by an additional 14,000 units this year, the third-largest total among major U.S. metros. While core Los Angeles continues to record the largest influx of new apartments, deliveries are more evenly distributed between Downtown Los Angeles, Mid-Wilshire and Hollywood than in previous years. Elsewhere, the San Fernando Valley will record a large increase of new units, welcoming more than 4,000 rentals, 40 percent of which are in Woodland Hills. Throughout the county, projects in lease-up will benefit from steep home prices and income growth, but concessions usage will increase as developers seek to achieve stabilization in under a year. With solid demand drivers in place, the overall impact of cycle-high delivery volume will be moderate, with metro vacancy rising to 4 percent.
New legislation forces investors to adjust expectations. Robust renter demand for lower-cost apartments will fuel buyer competition for properties near major freeways and employment hubs this year. While the implementation of statewide rent control could alter returns on Class C investments following a span of sizable rental rate gains in this tranche, tight conditions should allow for steady, yet more subdued, increases moving forward. In-county investors and regional 1031-exchange buyers should be most active, eyeing Koreatown, South Bay and the San Gabriel Valley, where pricing below $200,000 per unit and 5 percent-plus cap rates can be found. Hollywood, Mid-Wilshire and the San Fernando Valley represent additional targets for these buyers; however, yields beyond the mid-4 percent band will be harder to obtain as asset values in these locales rise.
Metro-level employment, vacancy and effective rents are year-end figures and are based on the most up-to-date information available as of November 2019. Effective rent is equal to asking rent less concessions. Average prices and cap rates are a function of the age, class and geographic area of the properties trading and therefore may not be representative of the market as a whole. Sales data includes transactions valued at $1,000,000 and greater unless otherwise noted. Forecasts for employment and apartment data are made during the fourth quarter and represent estimates of future performance. No representation, warranty or guarantee, express or implied may be made as to the accuracy or reliability of the information contained herein. This is not intended to be a forecast of future events and this is not a guaranty regarding a future event. This is not intended to provide specific investment advice and should not be considered as investment advice.